
Read your analytics
See what's selling, when you're busiest and exactly where your money goes — so every bake is based on better information.
5 min readUpdated August 2026Analytics turns your orders into a clear picture of your business. You don't need to be a numbers person — every panel answers a practical question about what to bake and when.
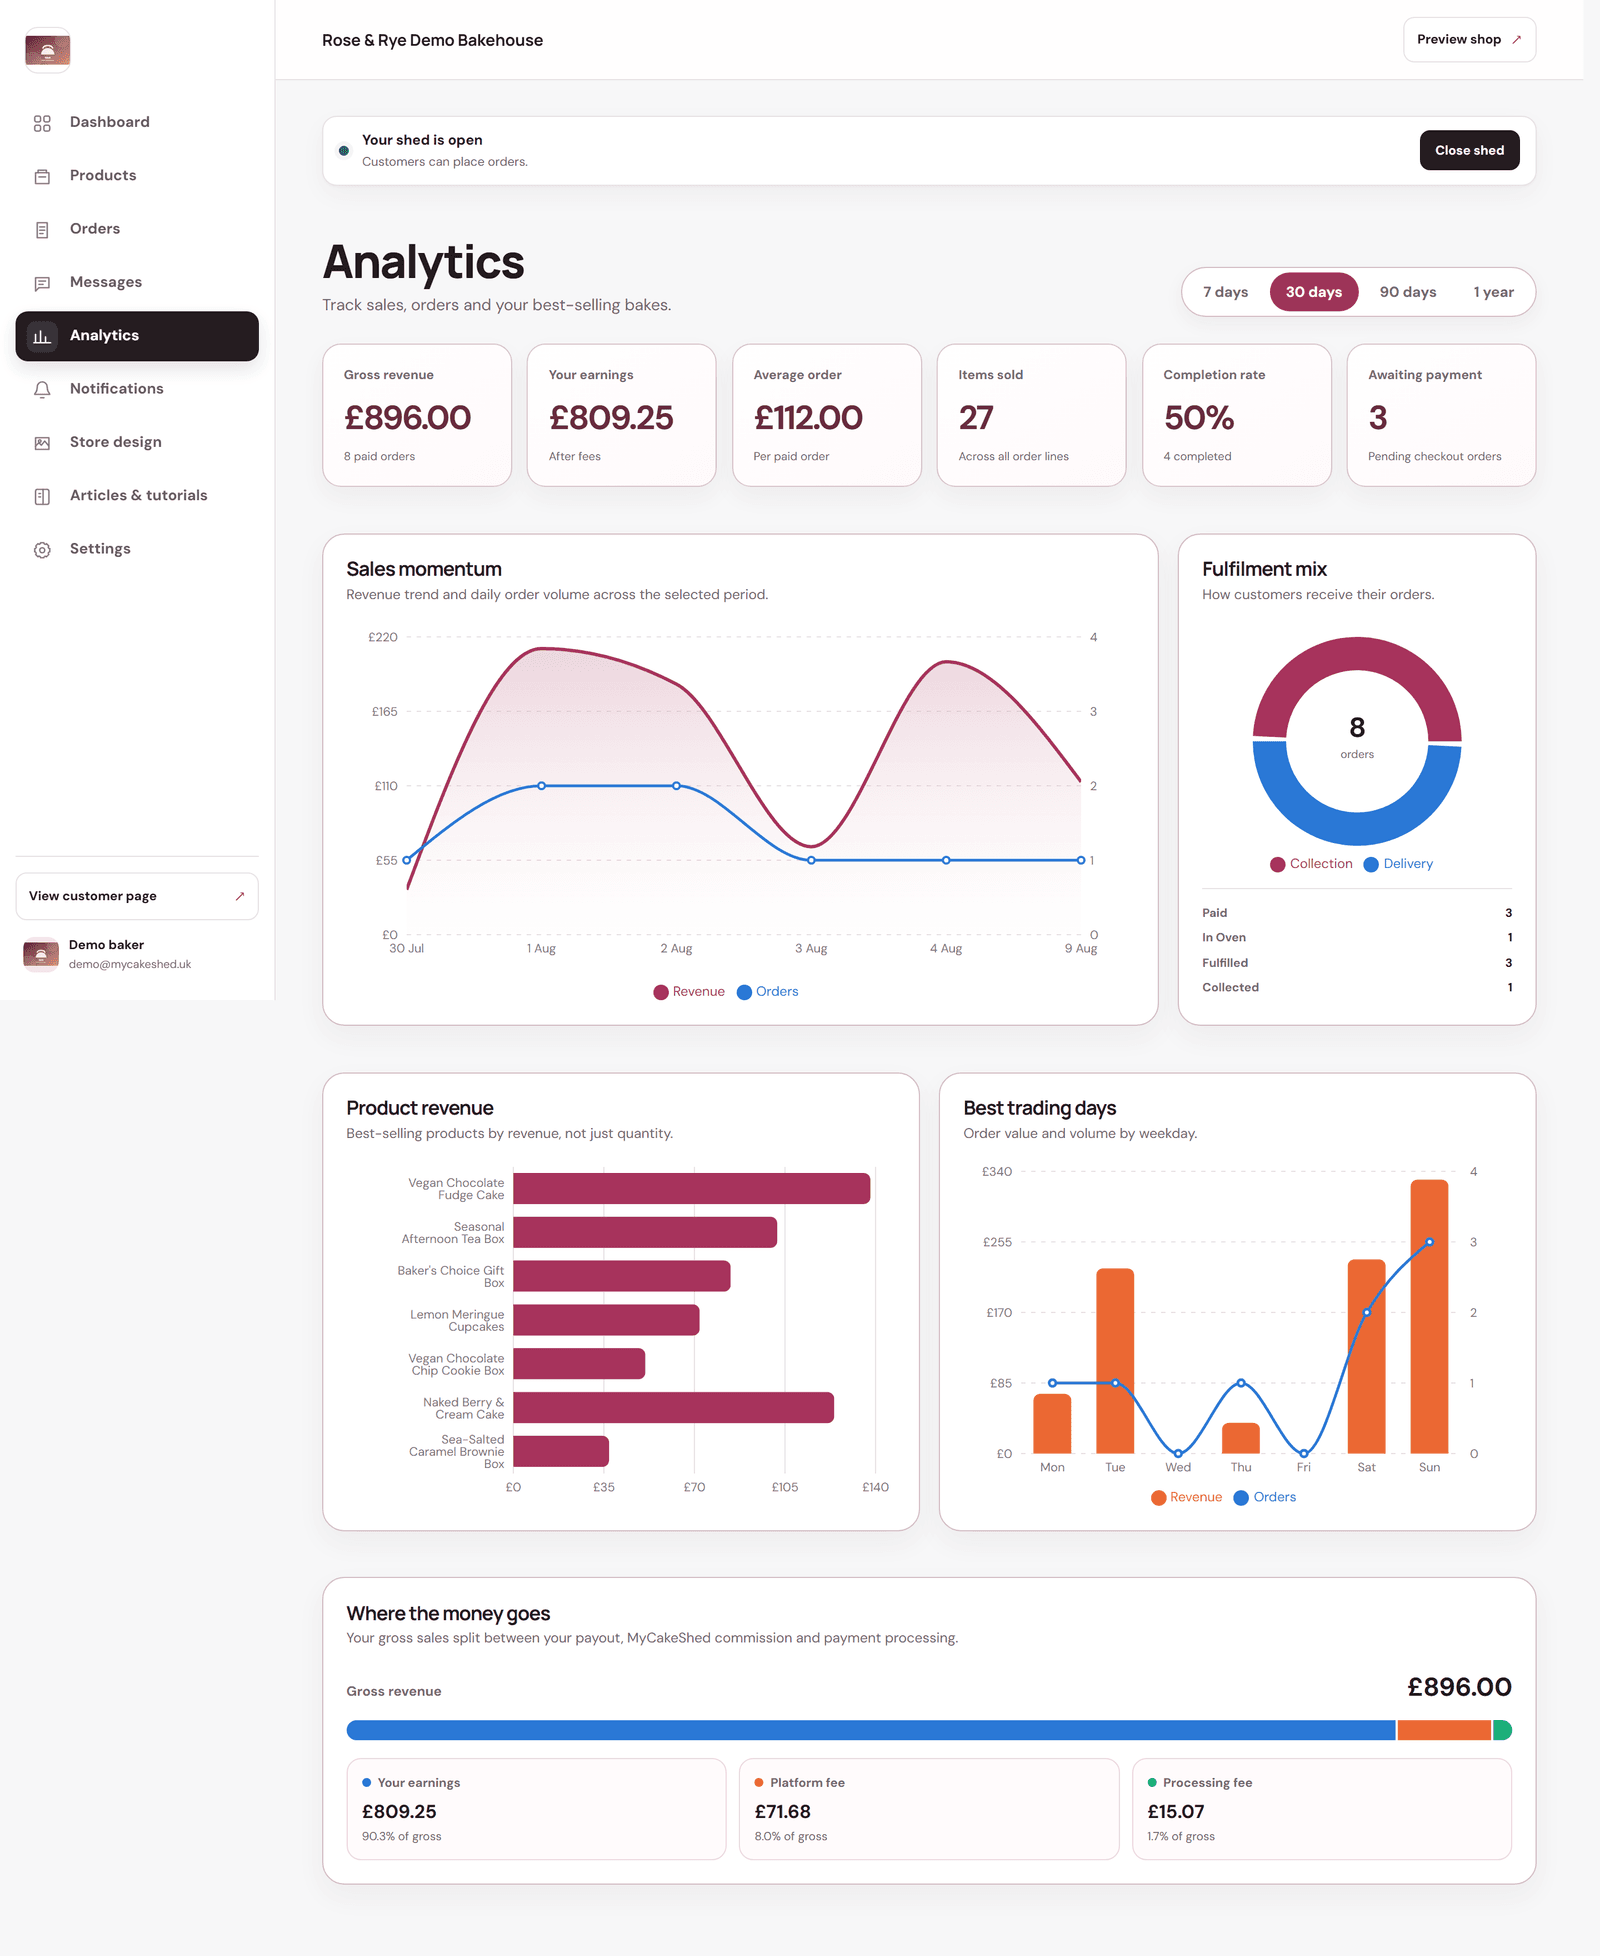
Start with the headline tiles
- Gross revenue and Your earnings — what you took in, and what's left after fees.
- Average order — how much a typical customer spends, useful when pricing bundles.
- Items sold and Completion rate — how much you've made and how much you've fulfilled.
- Awaiting payment — orders still at checkout that haven't completed.
Dig into the charts
- Sales momentum shows revenue and order volume over time, so you can see the effect of a post or a seasonal push.
- Fulfilment mix shows how customers split between collection and delivery.
- Product revenue ranks your best sellers by money made, not just quantity — sometimes a pricier cake beats a cheaper box.
- Best trading days shows which weekdays bring the most orders, so you can plan your baking and your offers around them.
See where the money goes
The "Where the money goes" bar splits your gross sales into your payout, the MyCakeShed fee and card processing — so you always know exactly what lands in your pocket.
Check your best trading days before setting deal dates. Running a midweek offer on your quietest day does more to fill your calendar than discounting a day that's already busy.